
The comparison between these methods centers on six measurable variables: nutrient retention rates (particularly heat-sensitive vitamins), preservative exposure (primarily sulfur dioxide), production cost per pound including 10:1 fresh-to-dried conversion ratios, sensory properties (texture and flavor intensity), required equipment investment, and microbial safety protocols including water activity control.
Commercial operations achieve consistency through standardized processing parameters. Home production offers ingredient control at the expense of batch variability. Cost advantage depends entirely on raw material sourcing—retail fresh fruit pricing makes homemade production economically equivalent or more expensive than store-bought for most common fruits. The exception occurs when fresh fruit costs under $0.80-1.00 per pound through garden production or bulk seasonal purchases.
Evaluation Framework
Analysis focuses on commonly dried fruits (apples, apricots, bananas, berries, stone fruits) rather than naturally low-moisture items (raisins, dates). Data derives from USDA nutritional databases, peer-reviewed food science literature, FDA regulations, and National Center for Home Food Preservation (NCHFP) safety protocols. Cost calculations include direct expenses (fruit, electricity) and equipment depreciation amortized over expected lifespan.
Safety Note: Home food preservation requires adherence to temperature guidelines, moisture reduction targets, and hygiene protocols established by NCHFP to prevent foodborne illness from inadequate drying or contamination.
Key Takeaways
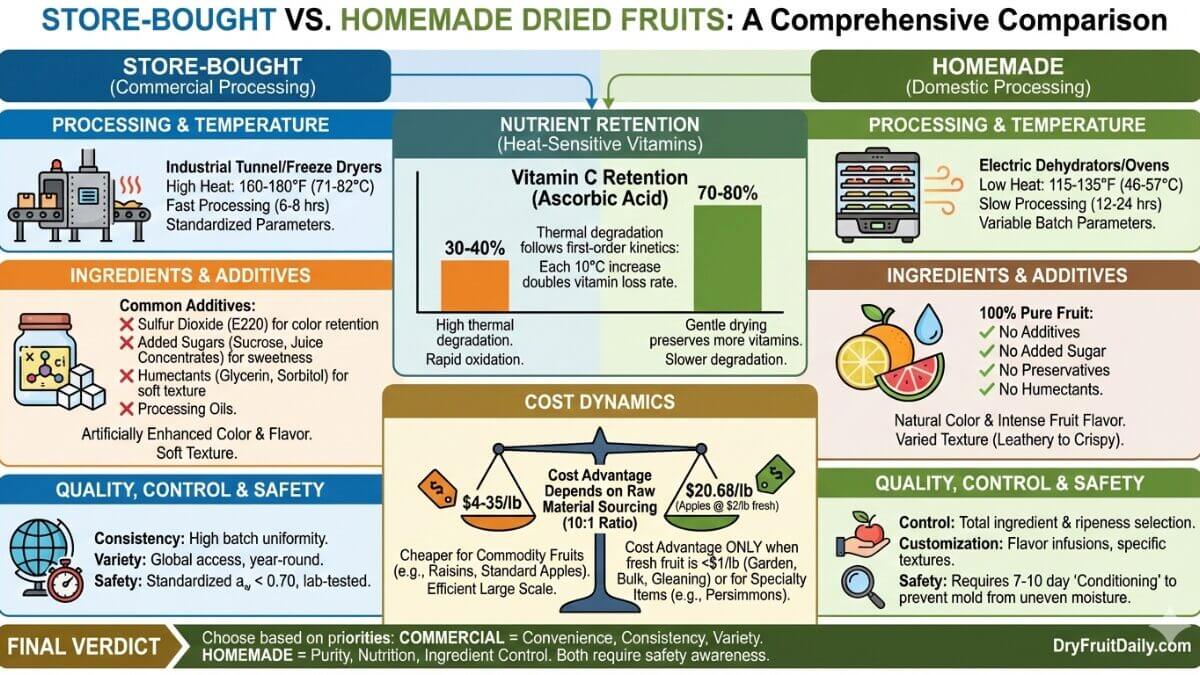
- Performance Trade-offs: Commercial dried fruit dominates in consistency, shelf stability, and exotic variety access. Homemade dried fruit dominates in ingredient transparency, additive elimination, and customization capability.
- Ingredient Control: Home dehydration eliminates sulfur dioxide (E220), added sugars (sucrose, fruit juice concentrate), humectants (glycerin, sorbitol), and processing oils present in most commercial products.
- Cost Reality: The 10:1 fresh-to-dried weight ratio dominates economics. At $2/lb fresh fruit, homemade costs $20.68/lb. Store-bought ranges $4-35/lb. Cost advantage requires fruit under $1/lb or specialty items where commercial products exceed $35/lb.
- Quality Dimensions: Home production allows peak-ripeness selection but limits variety to locally available fresh fruit. Commercial sourcing provides global supply chain access and year-round consistency.
- Nutrient Preservation: Low-temperature home dehydration (115-135°F) retains 70-80% of Vitamin C versus 30-40% in high-heat commercial tunnel dryers. Thermal degradation follows first-order kinetics—each 10°C increase doubles vitamin loss rate.
- Safety Requirements: Commercial products achieve standardized water activity through tested protocols and instrumentation. Home drying requires 7-10 day conditioning (moisture equilibration) to prevent mold from uneven moisture distribution.
What Are the Nutritional Differences Between Store-Bought and Homemade Dried Fruits?

Nutritional outcomes depend on three processing variables: drying temperature, exposure duration, and chemical treatment application. Heat-sensitive compounds degrade through oxidative reactions accelerated by thermal energy input.
Temperature Effects on Vitamin Retention Rates
Ascorbic acid (Vitamin C) exhibits exponential degradation above 140°F (60°C). Research in the Journal of Food Science (2018) quantified this: low-temperature drying preserves 60% more ascorbic acid than high-heat commercial methods. The mechanism involves oxidative breakdown where thermal energy accelerates electron transfer reactions that destroy the vitamin’s molecular structure.
Home dehydrators operate at 115-135°F (46-57°C), below critical degradation thresholds for water-soluble vitamins. Commercial tunnel dryers prioritize throughput at 160-180°F (71-82°C), completing cycles in 6-8 hours but accelerating nutrient loss. Home units require 12-24 hours—the time-temperature trade-off favors nutrient preservation at the expense of processing speed.
The degradation kinetics follow predictable patterns. For every 10°C temperature increase above 50°C, vitamin C degradation rate doubles. A fruit dried at 70°C loses vitamins 4 times faster than fruit dried at 50°C. This explains measurable nutritional differences despite processing identical starting materials. Understanding these thermal degradation pathways clarifies why gentle methods produce superior outcomes.
| Nutrient | Home Dehydrator (115-135°F) | Commercial High-Heat (160-180°F) | Freeze-Dried (Commercial) |
|---|---|---|---|
| Vitamin C (Ascorbic Acid) | 70-80% | 30-40% | 90-95% |
| B Vitamins (Thiamin, Riboflavin) | 65-75% | 40-50% | 85-90% |
| Dietary Fiber (Total) | 100% | 100% | 100% |
| Minerals (Ca, Fe, K, Mg) | 100% | 100% | 100% |
| Polyphenolic Compounds | 75-85% | 55-65% | 90-95% |
Structural nutrients show no degradation. Dietary fiber (cellulose, hemicellulose, pectin, lignin) and minerals (calcium, iron, potassium, magnesium, phosphorus) remain stable during dehydration. Water removal concentrates these components—100g dried apricots contain 4-5 times more fiber per gram than fresh apricots due to mass reduction without nutrient loss.
First-time batches tend to be overdried. People don’t trust the “leathery but pliable” guideline and keep drying until fruit feels completely rigid. This doesn’t harm nutrition significantly but creates unnecessarily tough texture requiring longer rehydration.
Sulfur Dioxide: Mechanism of Action and Health Implications
Sulfur dioxide (SO₂, designated E220 in European food additive nomenclature) functions as both color preservative and antimicrobial agent. The compound inhibits enzymatic browning by irreversibly denaturing polyphenol oxidase enzymes that catalyze melanin formation. It also reduces oxidative degradation by scavenging free radicals and lowering oxidation-reduction potential in fruit tissue.
When fruit is cut or damaged, polyphenol oxidase enzymes contact phenolic substrates, initiating oxidation reactions producing brown quinone compounds that polymerize into melanin pigments. This process turns sliced apples brown within 10-15 minutes. Sulfur dioxide blocks the enzyme’s copper prosthetic group, preventing substrate binding. Result: commercial apricots maintain bright orange color for 12-24 months while untreated fruit turns deep brown within hours of processing.
The FDA mandates disclosure for sulfite concentrations exceeding 10 parts per million (ppm). Most commercial dried fruits contain 500-3,000 ppm—50-300 times the labeling threshold. Products must display “Contains Sulfites” or specify exact sulfite compounds used (sodium sulfite, sodium bisulfite, sodium metabisulfite, sulfur dioxide).
Sulfite sensitivity prevalence: approximately 1% of general population, rising to 5-10% among asthma patients. Documented reactions include bronchoconstriction (airway narrowing), urticaria (hives), gastrointestinal cramping, and anaphylaxis requiring epinephrine intervention in severe cases. The FDA banned sulfite use on fresh produce served in restaurants after documented fatalities but permits use in processed products with mandatory labeling.
The color difference surprises most people. Homemade apricots look nothing like commercial versions—they’re dark brown instead of bright orange. The brown is natural. The orange requires chemical intervention. Understanding this distinction matters critically for respiratory-sensitive individuals.
These preservative considerations connect directly to another commercial practice: sugar addition to mask natural tartness and improve palatability.
Added Sugar: Identification and Quantification
Sugar addition converts naturally tart dried fruits into candy while maintaining “healthy fruit snack” marketing claims. Manufacturers add sucrose (table sugar), concentrated fruit juice (fructose solution), or invert sugar syrups to improve consumer acceptance of inherently sour fruits.
High-risk products for added sugar content:
- Cranberries: Natural dried cranberries contain 1g sugar per 1/4 cup (very tart, minimal consumer appeal). Sweetened commercial versions: 26-29g sugar per 1/4 cup. This represents 2,600-2,900% increase. Approximately 98% of retail dried cranberries are sweetened formulations—finding unsweetened versions requires specialty health food stores.
- Tart Cherries (Montmorency): pH 3.2-3.5 makes unsweetened dried cherries unpalatable to most consumers. Added sugar: 18-24g per 1/4 cup serving, similar to cranberries.
- Mango: Naturally contains 24g sugar per cup fresh. Some brands add supplemental sugar or fruit juice concentrate, pushing total to 30-35g per serving despite mango’s inherent sweetness.
- Pineapple: “Candied” pineapple (sugar-infused during processing) differs from “dried” pineapple (dehydrated only). Many products blur this distinction on packaging.
- Banana Chips: Often fried in coconut/palm oil and sugar-coated rather than air-dried. A 1oz serving: 10-12g added sugar plus 8-10g added fat from frying oil. Nutritionally closer to potato chips than fruit.
“Fruit juice sweetened” claims mislead consumers. Concentrated apple juice or white grape juice concentrate is chemically equivalent to sugar—fructose and glucose in solution. The glycemic response, insulin spike, and caloric content match refined sugar despite “natural” sourcing. Marketing language exploits consumer perception that “fruit juice” sounds healthier than “sugar.”
Homemade dried fruit contains exclusively intrinsic sugars present in fresh fruit. Water removal concentrates these natural sugars into smaller mass but adds nothing. This distinction impacts blood glucose management, caloric intake control, and dietary compliance. Compare sugar profiles across different fruits to make informed selections.
Worth clarifying: drying does not create “more” sugar. One grape contains 0.4g sugar. When dehydrated into a raisin, it still contains 0.4g sugar—unchanged. The mass decreases from 5g to 0.5g (water removal), creating higher sugar density per gram but identical total sugar unless manufacturers add supplemental sweeteners.
Nutrient composition and additive presence influence health outcomes. But cost efficiency determines whether home production remains practical long-term.
Is It Actually Cheaper to Make Dried Fruit at Home?
Cost analysis requires quantifying three expense categories: raw material input (fresh fruit at retail or bulk pricing), energy consumption (electricity for dehydrator operation), and equipment depreciation (initial purchase cost amortized over expected lifespan). The 10:1 fresh-to-dried weight ratio dominates total cost structure.
Apple Dehydration Economics: Real Numbers
Producing one pound of dried apple rings requires these inputs:
Fresh Fruit Input: Apples contain 84-86% water by weight. Removing this moisture creates the observed 10:1 conversion ratio—10 pounds fresh yields approximately 1 pound dried product. At $2.00/lb retail pricing for conventional apples (seasonal average across U.S. markets), raw material cost equals $20.00 per pound dried output.
Energy Consumption: Standard home dehydrator power rating: 500 watts (0.5 kilowatts). Apple drying duration: 8 hours at 135°F. Energy used: 0.5 kW × 8 hours = 4 kilowatt-hours (kWh). At U.S. average residential rate $0.17/kWh, operational cost: $0.68.
Total Direct Cost: $20.00 fruit + $0.68 electricity = $20.68/lb finished product.
This excludes equipment depreciation. A $150 dehydrator used 50 times over 5 years adds $3.00 per batch. Initial equipment investment represents the primary barrier to entry—not ongoing operational expenses.
Electricity Cost Formula: Why Everyone Overestimates This
People assume “running a machine overnight” consumes substantial power. The math proves otherwise.
Formula: (Watts ÷ 1,000) × Hours × Cost per kWh = Total Cost
Example using 600W dehydrator for 12-hour cycle:
- Convert to kilowatts: 600W ÷ 1,000 = 0.6 kW
- Calculate energy: 0.6 kW × 12 hours = 7.2 kWh
- Apply rate: 7.2 kWh × $0.17 = $1.22
Even 12-hour sessions cost under $1.50 in most states. Equipment wattage appears on labels (back panel or bottom). Your cost per kWh appears on electric bills.
Running a dehydrator overnight uses less energy than one clothes dryer cycle. Low-wattage heating elements and fans draw minimal power compared to high-draw appliances. Calculate your specific costs based on local electricity rates.
Electricity is not the problem. Fruit cost is.
When Homemade Achieves Cost Advantage
Commercial dried apples retail $12-20/lb depending on organic certification and brand. Homemade at $20.68/lb shows comparable or higher cost under retail fresh fruit purchasing.
Cost advantage occurs in three scenarios:
- Free or subsidized fruit: Garden production (zero cost), gleaning programs ($0-0.20/lb), or bulk farm purchases ($0.30-0.50/lb) reduce raw material expense 75-90%. This makes homemade economically superior.
- Specialty applications: Dried persimmons retail $35-50/lb commercially but cost $15-20/lb homemade using fresh persimmons at $3-4/lb wholesale. Specialty items often justify home production economically.
- Seasonal bulk processing: Peak harvest periods (late summer/early fall) drop fruit prices 60-70%. Apples at $0.80-1.00/lb during harvest reduce dried apple cost to $8-10/lb—well below commercial pricing.
Commodity items never achieve cost parity. Raisins and dates exemplify this: industrial facilities processing 50,000-100,000 pounds daily achieve efficiency impossible domestically. Store-bought raisins at $4-8/lb cost less than fresh grapes required for equivalent home production.
| Fruit Type | Homemade ($/lb) | Store-Bought Standard ($/lb) | Store-Bought Organic ($/lb) | Cost Advantage |
|---|---|---|---|---|
| Apples | $18-22 | $12-16 | $18-24 | Store-bought (standard) |
| Bananas | $12-15 | $8-12 | $14-18 | Store-bought (standard) |
| Strawberries | $35-45 | $25-35 | $40-55 | Store-bought (standard) |
| Raisins | $25-30 | $4-8 | $8-12 | Store-bought (massive) |
| Persimmons | $15-20 | $35-50 | $45-65 | Homemade (significant) |
The analysis reveals cost savings depend entirely on raw material sourcing rather than processing efficiency. Commercial scale advantages in processing remain insurmountable for home producers operating at 1-5 pound batch sizes.
Cost considerations influence decisions, but they interact with quality control dimensions that drive many consumers toward home production despite higher expenses.
Which Offers Better Quality Control and Variety?
Commercial dried fruit dominates in consistency, exotic variety, and year-round availability. Homemade dried fruit dominates in raw material selection control and additive elimination. These represent different quality dimensions rather than directly comparable attributes.
Input Selection Control: Home Production Strength
Home dehydration provides complete control over input quality parameters: ripeness level, organic certification status, visual defect screening, and cultivar selection. You examine each piece individually, rejecting bruised specimens and selecting peak-ripeness fruit that commercial grading systems would categorize identically based on size and color alone.
Custom processing unavailable commercially:
- Thickness variation for texture preference (paper-thin chips 1/16″ vs. thicker chewy slices 1/4″)
- Flavor infusions (vanilla-dusted peaches, cinnamon-spiced apples, lime-zested mango, cardamom pears)
- Heirloom variety preservation (obscure apple cultivars like Ashmead’s Kernel, rare stone fruit varieties unavailable commercially)
- Hybrid products (fruit leathers with custom flavor blends, trail mix components tailored to specific recipes)
The satisfaction of creating custom dried fruit blends unavailable retail appeals to food enthusiasts and culinary experimenters. Trail mix customization becomes viable when controlling component production.
Consistency and Exotic Variety: Commercial Strength
Industrial processing implements standardized grading systems ensuring uniform size distribution, moisture content, and visual appearance across batches. Statistical process control (SPC) monitors critical parameters continuously, maintaining coefficient of variation below 5% for moisture content—impossible domestically without laboratory-grade water activity meters.
Commercial operations access global supply chains: dried mango from India, pineapple from Thailand, goji berries from China, goldenberries from Colombia, dragon fruit from Vietnam. Local fresh markets rarely stock these items, and when available, pricing makes home dehydration economically prohibitive.
Consistency matters for recipe standardization. Commercial dried cranberries exhibit identical moisture (18-22%), size distribution (80% within ±2mm diameter), and sugar content (26-28g/serving) batch-to-batch. Home production variability ranges 15-25% depending on fruit ripeness, slice thickness uniformity, and drying duration accuracy.
Quality differences emerge from different optimization targets: home producers maximize purity and customization while commercial producers maximize consistency and variety. Neither approach is “better”—they serve different consumer priorities.
Quality extends beyond raw materials to sensory characteristics—texture and flavor profiles directly influenced by processing methods and additive applications.
How Does Taste and Texture Compare?
Sensory characteristics—texture, chewiness, flavor intensity, rehydration behavior—derive from three processing factors: final moisture content (target 15-20% for most fruits), humectant addition (moisture-retaining compounds), and sugar coating application.
Texture Modification Through Humectants
Store-bought dried fruit maintains soft, pliable texture through humectant addition. Humectants are hygroscopic compounds (water-attracting molecules) that bind water through hydrogen bonding, preventing excessive dehydration during storage. Common humectants include:
- Glycerin (glycerol): Three-carbon alcohol with three hydroxyl groups providing multiple water-binding sites
- Sorbitol: Sugar alcohol derived from glucose, providing sweetness plus moisture retention
- Propylene glycol: Two-carbon diol approved for food use, prevents crystallization
These compounds serve dual functions: maintaining consumer-preferred soft texture and preventing moisture loss that would create brittle, hard products during 12-24 month shelf life. The result is unnaturally soft dried fruit retaining 20-25% moisture versus properly dried homemade fruit at 15-20% moisture.
Homemade texture depends on drying endpoint:
- Leathery (15-20% moisture): Properly dried apples, pears, peaches, apricots bend without breaking and show no moisture when torn. Ideal endpoint for most fruits.
- Crispy (5-10% moisture): Very thin apple chips or banana slices dried until fully crisp snap cleanly. Overdrying beyond this creates tooth-breaking hardness.
- Chewy (20-25% moisture): Berries and grapes achieve raisin-like consistency—pliable and chewy without stickiness or visible wet spots when compressed.
Texture troubleshooting: too hard indicates excessive drying; sticky or moisture-leaving indicates insufficient drying risking mold. The conditioning process identifies issues before storage. Common problems stem from uneven air circulation or incorrect temperature.
Flavor Intensity and Sugar Concentration
Homemade dried fruit tastes more intensely fruit-forward because processing adds nothing. No oils, no refined sugars, no flavor enhancers. Natural fruit sugars concentrate 4-5 fold per gram during water removal without additive inputs.
Commercial products with added sugar create artificially enhanced sweetness masking natural fruit flavor. Sweetened dried cranberries taste predominantly of sugar (26-29g added per serving) rather than cranberry (1g natural sugar). The cranberry flavor becomes secondary to sugar flavor—essentially fruit-flavored candy.
Oil-fried banana chips demonstrate mechanical texture modification: coconut or palm oil frying creates crispiness mechanically different from air-dried slices. The oil coating adds 8-10g fat per serving and neutral fat flavor masking banana taste. Air-dried homemade chips contain zero added fat and taste purely of concentrated banana.
Rehydration behavior differs significantly. Homemade dried fruit rehydrates more completely when soaked because cell structure remains largely intact. Commercial fruit containing stabilizers and preservatives often exhibits incomplete rehydration—the additives interfere with water reabsorption into cellular tissue.
Achieving desired sensory outcomes requires appropriate equipment selection and proper technique application—the practical requirements for home fruit dehydration.
What Equipment Do You Strictly Need to Start?
Home fruit dehydration requires equipment providing three functions: controlled low-temperature heat (95-165°F), continuous air circulation for moisture removal, and surface area for fruit placement. Investment ranges $0 (oven method using existing equipment) to $400+ (premium dehydrator systems).
Dedicated Dehydrators: Purpose-Built Equipment
Electric food dehydrators are engineered specifically for fruit and vegetable dehydration, providing temperature control, airflow optimization, and expanded capacity unachievable with general-purpose appliances.
Critical specifications:
- Temperature range: Adjustable 95-165°F (35-74°C) enables optimization for different fruits. Citrus requires 135°F; strawberries dry optimally at 125°F. Digital control maintains ±2°F accuracy.
- Airflow configuration: Horizontal systems (fan located rear or side) provide more even drying than vertical models (fan in base). Horizontal designs eliminate tray rotation requirements.
- Capacity and expandability: Entry-level offers 4-5 trays; mid-range provides 9-12 trays; premium systems 15+ trays. Tray square footage determines batch size.
- Timer functionality: Built-in timers prevent overdrying during overnight sessions. Digital timers typically offer 0.5-48 hour range.
- BPA-free construction: Food-contact surfaces should use BPA-free plastics or stainless steel preventing chemical leaching during prolonged heating.
Entry-level ($50-70): vertical airflow, manual temperature control, 4-5 fixed trays. Mid-range ($100-180): digital controls, expandable capacity, timer functions. Premium like Excalibur ($250-400): commercial-grade construction, 15+ trays, precise temperature/airflow management.
Equipment lifespan averages 10-15 years with proper maintenance (annual cleaning, fan inspection). Amortizing $150 over 10 years equals $15 annually—negligible compared to ongoing fruit purchasing. Detailed operation instructions optimize results.
Oven Drying: Budget Alternative with Significant Constraints
Conventional oven dehydration requires no equipment purchase but imposes operational constraints. Primary challenge: most ovens can’t maintain temperatures below 170°F (77°C)—well above optimal 135-145°F fruit drying temperature.
Successful oven drying requirements:
- Oven maintains 140-150°F (60-65°C) with reasonable accuracy (±10°F tolerance)
- Door remains propped open 2-4 inches throughout drying allowing moisture escape
- External fan positioned near oven improves air circulation
- Fruit trays require hourly rotation compensating for uneven heat distribution
- Drying duration extends 6-12 hours depending on fruit type and slice thickness
Energy consumption exceeds dehydrator usage by 300-500%. A 10-hour oven session at 2,500 watts costs $4.25 versus $0.85 for equivalent dehydrator operation. Results are less consistent due to temperature fluctuations and uneven airflow.
Oven drying allows experimentation before equipment commitment. Complete protocols appear in our oven dehydration guide.
Air Fryers: Emerging Option with Capacity Limits
Modern air fryers increasingly include “dehydrate” mode operating at reduced temperatures (120-150°F) suitable for fruit drying. This differs fundamentally from standard air frying (350-400°F) designed for cooking rather than dehydrating.
Advantages: multi-function appliance, compact footprint, faster preheating, suitable for recipe testing and small-batch production.
Limitations: restricted capacity (1-2 trays holding 0.25-0.5 lb fresh fruit), less consistent circulation than dedicated units, not all models include true low-temperature function, tray spacing constraints limit slice size.
Verify your specific model includes dedicated dehydrate setting. Standard air fry mode will cook fruit, producing baked chips rather than properly dried product.
Essential Accessories
- Mandoline slicer: Creates uniform thickness critical for even drying. Adjustable models allow 1/16″ to 1/4″ thickness selection. Uniform thickness ensures all pieces finish simultaneously.
- Silicone mats or parchment paper: Prevents sticking for sticky fruits (figs, dates, very ripe peaches). Reusable silicone outlasts parchment economically.
- Sharp stainless steel knives: Essential for preparation—coring apples, pitting stone fruits, removing stems and seeds.
- Glass jars with airtight lids: Required for conditioning (moisture equilibration) and storage. Mason jars with two-piece lids work ideally.
- Lemon juice: Optional pre-treatment (1/4 cup lemon juice per 1 cup water) slows enzymatic browning in light-colored fruits.
The critical factor for successful dehydration is airflow, not heat. Moisture evaporation requires moving air to carry water vapor away from fruit surfaces. Stagnant air saturates with moisture, halting evaporation regardless of temperature. Any method lacking consistent airflow produces uneven results.
| Equipment | Advantages | Disadvantages | Optimal Use Case |
|---|---|---|---|
| Dedicated Dehydrator | Precise temperature, optimal airflow, energy efficient, large capacity (15+ trays), hands-off operation | Initial cost $50-400, requires storage space, single-purpose appliance | Regular use (monthly+), large batches, highest quality requirements |
| Conventional Oven | No equipment purchase, immediate availability, no learning curve | Inconsistent results, 3-5x higher energy cost, hourly monitoring required, ties up oven 6-12 hours | One-time experimentation, testing before purchase, occasional small batches |
| Air Fryer | Multi-function appliance, compact, good for testing, faster than oven | Very limited capacity (0.25-0.5 lb), fewer trays (1-2), not all models have proper range | Small households, recipe development, space-constrained kitchens |
Equipment investment represents initial barrier, but ongoing costs and safety protocols determine long-term viability. Storage methods directly impact whether investment produces usable product or mold-contaminated waste.
How Long Does Homemade Dried Fruit Last vs. Store-Bought?
Shelf life depends on water activity (aw), storage conditions, and antimicrobial preservative presence. Commercial products achieve 12-36 month stability through precision drying and chemical preservation. Homemade requires careful moisture management and conditioning protocols achieving 6-18 month stability.
Water Activity: Quantifying Microbial Stability
Water activity (aw) is a measurable indicator of free water in food, expressed on a 0-1 scale where 0.00 represents completely dry and 1.00 represents pure water. This metric quantifies water available for microbial growth, chemical reactions, and enzymatic activity—not total moisture content but specifically the unbound water fraction accessible to microorganisms.
Microbial growth thresholds:
- Most bacteria require aw > 0.90 for growth
- Most yeasts require aw > 0.85 for growth
- Most molds tolerate aw as low as 0.70-0.80 for growth
- Halophilic (salt-tolerant) bacteria can grow at aw 0.75
- Xerophilic (drought-tolerant) molds can grow at aw 0.65
Safe dried fruit targets aw below 0.70 preventing all microbial growth except xerophilic molds, which grow extremely slowly at this level. At aw 0.60-0.65, even xerophilic species cannot establish colonies. Commercial facilities use electronic water activity meters to verify each batch achieves safety threshold before packaging.
Home producers lack measurement equipment. Instead, we use physical indicators: properly dried fruit should be leathery and pliable (not brittle), show no moisture beads when cut or torn, feel dry to touch. These qualitative assessments approximate 15-20% moisture content correlating to aw 0.60-0.70—the target safety range established by NCHFP guidelines.
Conditioning Protocol: Mandatory Safety Step
Conditioning equalizes moisture distribution across dried pieces, preventing localized high-moisture pockets enabling mold colonization. Home drying creates uneven results—pieces near heating element or high-airflow zones dry to 10-12% moisture while low-circulation areas remain at 25-30% moisture. Without conditioning, these high-moisture pieces support mold growth during storage.
Detailed conditioning procedure:
- Cool completely: Allow dried fruit to reach room temperature (2-3 hours). Hot fruit releases moisture vapor condensing on container walls.
- Loosely pack glass jars: Fill wide-mouth jars 60-70% full leaving significant headspace. Glass allows moisture observation; plastic absorbs odors and obscures condensation.
- Seal tightly: Use two-piece canning lids or single-piece screw-top lids with intact seals. Air-tight closure is mandatory.
- Shake daily 7-10 days: Once or twice daily, shake jars vigorously redistributing fruit and promoting moisture equilibration.
- Inspect for condensation: Check jar interior walls and lid underside daily. Any visible moisture droplets indicate excessive moisture requiring additional drying.
- Return wet batches to dehydrator: If condensation appears, spread fruit on trays and dry additional 2-4 hours. Repeat conditioning.
Commercial producers achieve even drying through calibrated equipment making conditioning unnecessary. Industrial tunnel dryers maintain uniform temperature and airflow across all product, ensuring consistent final moisture within ±2% across entire batch.
After successful conditioning (no condensation 7+ days), transfer to long-term storage. Options include vacuum-sealed bags, Mylar bags with oxygen absorbers, or freezer storage. Optimal storage methods extend longevity significantly.
Storage Duration Expectations
Storage temperature, light exposure, and oxygen availability impact longevity. Cool, dark, dry conditions extend shelf life regardless of production method.
| Storage Method | Homemade (conditioned) | Store-Bought (unopened) | Store-Bought (opened) |
|---|---|---|---|
| Pantry 68-72°F | 6-12 months | 12-24 months | 6-12 months |
| Refrigerator 35-40°F | 12-18 months | 18-24 months | 12-18 months |
| Freezer 0°F | 18-24 months | 24-36+ months | 24-36+ months |
| Vacuum-Sealed (pantry) | 12-18 months | 24-36 months | N/A |
| Mylar + O₂ Absorber | 18-24 months | 24-48 months | N/A |
Preservative Impact on Commercial Longevity
Store-bought achieves superior shelf life partially through chemical preservation. Sulfur dioxide functions as both color preservative and antimicrobial agent at concentrations 500-3,000 ppm. Sorbates (potassium sorbate, E202) and benzoates (sodium benzoate, E211) provide additional antimicrobial protection.
These preservatives allow unrefrigerated shelf storage 12-24 months without quality degradation. The same products without preservatives would require refrigeration and exhibit 6-12 month maximum shelf life—comparable to homemade products.
Spoilage Indicators
Inspect stored dried fruit periodically. Discard immediately if you observe:
- Visible mold: Fuzzy spots, unusual colors (white, green, black), or powdery residue
- Off odors: Musty, fermented, sour, or rancid smells indicating microbial contamination or rancidity
- Unexpected moisture: Should not leave moisture on fingers or feel wet when compressed
- Discoloration: Extreme darkening or unusual color shifts suggest oxidative degradation
- Insect presence: Indian meal moths, grain beetles, or other pantry pests
- Texture changes: Excessive hardening, unusual softening, or slimy texture development
When uncertain, discard. The cost of dried fruit is negligible compared to foodborne illness risk. Mold produces mycotoxins remaining present even if visible mold is removed—the entire batch requires disposal if any mold appears.
Store-Bought vs. Homemade: Which Is Right for You?
Commercial dried fruit dominates in consistency, exotic variety, and shelf stability. Homemade dried fruit dominates in ingredient transparency, additive elimination, and customization capability. Neither approach is universally superior—they serve different consumer priorities.
| Factor | Homemade | Store-Bought |
|---|---|---|
| Strengths | Zero additives (no sulfites, added sugars, oils); complete raw material control; custom flavoring; therapeutic satisfaction; optimized for dietary restrictions | Maximum convenience; reliable consistency; exotic variety; long guaranteed shelf life; cost-competitive for commodity items; minimal time investment |
| Weaknesses | Significant time commitment (4-6 hours active + 8-24 hours drying); equipment investment; batch variability; mold risk if improperly dried; limited to local fresh fruit | Frequent preservative presence; added sugar in tart fruits; processing oils in some products; less control over raw material quality; packaging waste |
| Optimal User | Sulfite-sensitive individuals; those with garden/orchard access; dietary restriction requirements; food preservation enthusiasts; consumers prioritizing purity over convenience | Time-constrained professionals; exotic variety seekers; recipe consistency requirements; apartment dwellers without processing space; commodity item buyers (raisins, dates) |
| Cost Efficiency | Superior with free/cheap fruit ($0.20-0.80/lb fresh). Inferior with retail fresh fruit ($2-4/lb). | Superior for commodity items (raisins $4-8/lb). Competitive for common fruits. Expensive for specialty/organic. |
Decision Criteria
Choose homemade if you meet 3+ criteria:
- Documented sulfite sensitivity or asthma exacerbated by preservatives
- Access to garden production, fruit trees, or bulk farm purchases under $1/lb
- Requirement for zero-additive foods due to dietary restrictions or preferences
- Interest in food preservation as rewarding hobby rather than purely utilitarian
- Need for precise glycemic control or sugar content management
- Desire for custom flavor combinations unavailable commercially
- Available time for 4-6 hours active processing plus 8-24 hours drying per batch
Choose store-bought if you meet 3+ criteria:
- Time constraints prioritize convenience over ingredient control
- Interest in exotic fruits (mango, papaya, dragon fruit, goldenberries) rarely available fresh
- Need for batch-to-batch consistency for recipe standardization
- Limited kitchen space prevents dehydrator storage
- Primary consumption is commodity items (raisins, dates, prunes) where commercial achieves cost advantage
- Access to organic, unsulphured commercial options meeting ingredient standards
- No sulfite sensitivity or preservative concerns
Hybrid Strategy: Optimizing Both Approaches
Experienced consumers often adopt hybrid strategies: purchasing commodity items commercially while producing specialty items domestically.
Typical hybrid approach:
- Buy commercially: Raisins, dates, prunes—items where commercial achieves 50-75% cost advantage and quality is acceptable
- Make at home: Apple chips, pear slices, stone fruits, berries—items where you control seasonal sourcing, avoid unwanted additives, and produce superior quality
- Seasonal bulk production: Process large quantities during peak harvest (late summer/early fall) when fruit prices drop 60-70%, rely on commercial during off-season
This strategy requires initial dehydrator investment but produces ongoing benefits: additive elimination for frequently consumed items, cost savings on specialty fruits, and hobby satisfaction without complete dependence on time-intensive processing.
Understanding different categories helps identify which items warrant home production versus commercial purchase based on processing complexity and cost structure.
Frequently Asked Questions
Q: Is homemade dried fruit healthier than store-bought?
It depends on what health factor you prioritize. Homemade avoids preservatives (sulfur dioxide), added sugars, and processing oils—superior for sulfite-sensitive individuals or those seeking additive-free foods. Low-temperature home dehydration (115-135°F) preserves 70-80% of Vitamin C versus 30-40% in high-heat commercial processing. However, commercial freeze-dried products retain 90-95% of nutrients—superior to any home method. The primary health advantage of homemade comes from ingredient control, not inherently superior nutrition across all metrics.
Q: Is it cheaper to make your own dried fruit?
Usually not, unless you have access to fruit under $1/lb. The 10:1 fresh-to-dried weight ratio means 10 pounds fresh apples ($20 at $2/lb) produces 1 pound dried ($20.68 including electricity). Store-bought dried apples cost $12-20/lb. You save money only when fresh fruit costs under $0.80-1.00/lb—typical for garden production, gleaning programs, or peak-season bulk purchases. Commodity items like raisins are always cheaper to buy ($4-8/lb) than make ($25-30/lb) due to massive commercial scale advantages.
Q: When does making your own make financial sense?
When you have fruit under $1/lb or when commercial equivalent exceeds $35/lb. Examples: garden production (free), bulk farm purchases during harvest ($0.20-0.50/lb), or specialty items like dried persimmons (homemade $15-20/lb vs. commercial $35-50/lb). Raw material cost dominates expenses—electricity adds only $0.50-1.50 per batch regardless of quantity.
Q: What is the best equipment for home dehydration?
A dedicated electric food dehydrator with horizontal airflow and adjustable temperature control (95-165°F). Entry-level models start $50-70, mid-range $100-180, premium systems like Excalibur $250-400. Key features: temperature accuracy ±2°F, horizontal airflow (eliminates tray rotation), expandable capacity, built-in timer. These provide consistent results impossible with ovens or air fryers due to precise temperature and airflow management.
Q: Can I make raisins at home?
Yes, but it’s economically inefficient. Drying grapes into raisins takes 24-48 hours and costs $25-30/lb after accounting for fresh grape prices and shrinkage. Commercial raisins cost $4-8/lb due to massive scale. Home raisin production makes sense only if you grow grapes or want specific varieties unavailable commercially (e.g., Concord grape raisins).
Q: Why is homemade fruit dark brown instead of bright orange?
Because it’s natural and untreated. Enzymatic browning occurs when polyphenol oxidase enzymes contact oxygen after fruit tissue is cut, producing brown melanin pigments. Commercial apricots stay bright orange because sulfur dioxide denatures these enzymes, preventing color change. Your brown fruit is chemical-free. The color difference is cosmetic, not nutritional.
Q: How long does homemade last compared to store-bought?
Homemade: 6-12 months room temperature if properly dried and conditioned. Store-bought: 12-24 months due to preservatives and precision processing. Refrigeration extends both to 12-18 months (homemade) and 18-24 months (commercial). Freezing extends to 18-24 months (homemade) and 24-36+ months (commercial). The difference comes from sulfur dioxide antimicrobial effects and more consistent industrial moisture removal achieving precise water activity levels.
Q: Can I use an air fryer to dehydrate fruit?
Only if your air fryer has dedicated “dehydrate” mode operating at 120-150°F. Standard air fry mode (350-400°F) will cook fruit, producing baked chips rather than properly dried product. Even with dehydrate function, capacity is limited to 0.25-0.5 lb per batch (1-2 trays). Air fryers work for testing recipes but can’t replace dedicated dehydrators for regular production due to capacity constraints and less consistent airflow.
Q: How do you prevent homemade fruit from turning brown?
Pre-treat with acidic solution before drying, though browning is harmless. Dip sliced fruit in solution of 1/4 cup lemon juice per 1 cup water for 5-10 minutes before drying. Citric acid lowers pH, slowing polyphenol oxidase enzyme activity. Ascorbic acid (vitamin C powder) works similarly. However, natural browning indicates absence of chemical preservatives—it’s a quality indicator, not a defect.
Q: Why must I “condition” homemade dried fruit?
Conditioning redistributes moisture evenly, preventing mold from localized wet spots. Home drying creates uneven distribution—pieces near heating elements reach 10% moisture while others stay at 25%. Packing together without conditioning allows high-moisture pieces to support mold growth. The 7-10 day conditioning process (storing loosely in jars, shaking daily, checking for condensation) equilibrates moisture and reveals insufficiently dried pieces before mold develops.
Q: How do you know when fruit is completely finished drying?
Properly dried fruit should be leathery and pliable (not brittle) with no visible moisture when torn or cut. For most fruits: bends without breaking, no moisture beads when compressed, feels dry to touch. Crispy chips should snap cleanly. After drying, always condition 7-10 days—if condensation appears in jar, return fruit to dehydrator for 2-4 more hours. Conditioning is mandatory, not optional. Target 15-20% moisture content, equivalent to water activity below 0.70.
Q: Can any fruit be dried at home successfully?
Most fruits dry successfully; a few are impractical. Excellent candidates: apples, pears, peaches, apricots, plums, berries, bananas, grapes, cherries, figs, persimmons, mangoes, pineapples. Poor candidates: watermelon (96% water produces minimal yield), citrus segments (too wet, better as zest), avocados (high fat interferes with preservation). Success depends on fruit structure and moisture content—fruits with 75-85% water work best.
Q: Why are store-bought fruits so uniform?
Industrial grading machines sort fruit by size, color, weight, and visual quality before processing. Mechanical systems use optical sensors, weight scales, and size screens categorizing fruit into grade A (premium), grade B (standard), and grade C (discount/processing). Each grade is processed and packaged separately, ensuring every bag contains consistent product. Home producers hand-select but lack mechanical consistency, resulting in natural size variation.
Q: Does dried fruit contain more sugar than fresh?
No, it contains the same amount concentrated into smaller mass. One grape contains 0.4g sugar. When dried into a raisin, it still contains 0.4g sugar—but the mass decreases from 5g to 0.5g (water removal). This creates higher sugar density per gram (80% vs. 8% by weight) but identical total sugar. Fresh grapes contain 16g sugar per cup; raisins contain 86g sugar per cup—but you’re comparing 151g fruit (fresh) to 145g fruit (dried). Commercial products with added sugar genuinely contain more total sugar beyond the fruit’s natural content.
How we reviewed this article:
▼This article was reviewed for accuracy and updated to reflect the latest scientific findings. Our content is periodically revised to ensure it remains a reliable, evidence-based resource.
- Current Version 13/02/2026Written By Team DFDEdited By Deepak YadavFact Checked By Himani (Institute for Integrative Nutrition(IIN), NY)Copy Edited By Copy Editors
Our mission is to demystify the complex world of nutritional science. We are dedicated to providing clear, objective, and evidence-based information on dry fruits and healthy living, grounded in rigorous research. We believe that by empowering our readers with trustworthy knowledge, we can help them build healthier, more informed lifestyles.